United States presidential elections in Florida
Following is a table of United States presidential elections in Florida, ordered by year. Since its admission to statehood in 1845, Florida has participated in every U.S. presidential election except the election of 1864, during the American Civil War, when the state had seceded to join the Confederacy. Florida has backed the winning candidate from 1996 to 2016, the longest active streak of any state except Ohio, and has only backed the losing candidate three times since 1928.
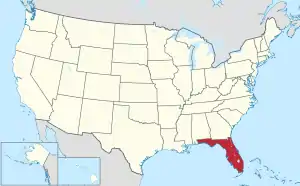 | |
| No. of elections | 43 |
|---|---|
| Voted Democratic | 25 |
| Voted Republican | 17 |
| Voted Whig | 1 |
| Voted other | 0 |
| Voted for winning candidate | 31 |
| Voted for losing candidate | 12 |
Winners of the state are in bold. The shading refers to the state winner.
Elections from 1864 to present
Election of 1860
The election of 1860 was a complex realigning election in which the breakdown of the previous two-party alignment culminated in four parties each competing for influence in different parts of the country. The election of Abraham Lincoln, an ardent opponent of slavery, spurred the secession of eleven states and brought about the American Civil War.
| Year | Winner (nationally) | Votes | Percent | Runner-up (nationally) | Votes | Percent | Runner-up (nationally) | Votes | Percent | Runner-up (nationally) | Votes | Percent | Electoral Votes |
|---|---|---|---|---|---|---|---|---|---|---|---|---|---|
| 1860 | Abraham Lincoln | no ballots | Stephen A. Douglas | 223 | 1.7 | John C. Breckinridge | 8,277 | 62.2 | John Bell | 4,801 | 36.1 | 3 |
Elections prior to 1860
| Year | Winner (nationally) | Votes | Percent | Runner-up (nationally) | Votes | Percent | Other national candidates[lower-alpha 1] |
Votes | Percent | Electoral Votes |
Notes |
|---|---|---|---|---|---|---|---|---|---|---|---|
| 1856 | James Buchanan | 6,358 | 56.81 | John C. Frémont | no ballots | Millard Fillmore | 4,833 | 43.19 | 3 | ||
| 1852 | Franklin Pierce | 4,318 | 60.03 | Winfield Scott | 2,875 | 39.97 | John P. Hale | no ballots | 3 | ||
| 1848 | Zachary Taylor | 4,120 | 57.2 | Lewis Cass | 3,083 | 42.8 | Martin Van Buren | no ballots | 3 |
References
- "Presidential Election Results: Biden Wins". The New York Times. Retrieved November 15, 2020.
- 2016 official Federal Election Commission report.
- https://www.politico.com/2016-election/results/map/president/florida/
- 2012 official Federal Election Commission report.
- 2008 official Federal Election Commission report.
- "Federal Elections 2004: Election Results for the U.S. President, the U.S. Senate and the U.S. House of Representatives" (PDF). Federal Elections Commission. May 2005.
- "2000 Presidential Election Statistics". Dave Leip’s Atlas of U.S. Presidential Elections.
- "1996 Presidential Election Statistics". Dave Leip’s Atlas of U.S. Presidential Elections. Retrieved 2018-03-05.
- Dave Leip’s U.S. Election Atlas; 1876 Presidential General Election Results – Florida
Notes
- For purposes of these lists, other national candidates are defined as those who won at least one electoral vote, or won at least ten percent of the vote in multiple states.
- Won the electoral college while losing the popular vote
- Was allied with a slate of unpledged electors in Louisiana, Mississippi and South Carolina
- Due to the status of Reconstruction, no election was held; three electoral votes were allocated by the Florida State Legislature to Ulysses S. Grant.