United States presidential elections in Arizona
Following is a table of United States presidential elections in Arizona, ordered by year. Since its admission to statehood in 1912, Arizona has participated in every U.S. presidential election.
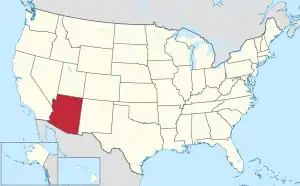 | |
| No. of elections | 28 |
|---|---|
| Voted Democratic | 9 |
| Voted Republican | 19 |
| Voted other | 0 |
| Voted for winning candidate | 21 |
| Voted for losing candidate | 6 |
The winners of the state election are in bold and shown with the colour of their political party.
Notes
- For purposes of these lists, other national candidates are defined as those who won at least one electoral vote, or won at least ten percent of the vote in multiple states.
- Won the electoral college while losing the popular vote
- Was allied with a slate of unpledged electors in Louisiana, Mississippi and South Carolina
References
- "Presidential Election Results: Biden Wins". The New York Times. Retrieved November 15, 2020.
- 2016 official Federal Election Commission report.
- 2012 official Federal Election Commission report.
- 2008 official Federal Election Commission report.
- "Federal Elections 2004: Election Results for the U.S. President, the U.S. Senate and the U.S. House of Representatives" (PDF). Federal Elections Commission. May 2005.
- "2000 Presidential Election Statistics". Dave Leip’s Atlas of U.S. Presidential Elections.
- "1996 Presidential Election Statistics". Dave Leip’s Atlas of U.S. Presidential Elections. Retrieved 2018-03-05.
See also
This article is issued from Wikipedia. The text is licensed under Creative Commons - Attribution - Sharealike. Additional terms may apply for the media files.