2018 South Lakeland District Council election
The 2018 South Lakeland District Council election took place on 3 May 2018 to elect members of South Lakeland District Council in Cumbria, England. The whole council was up for election with boundary changes since the last election in 2016, these major changes to boundaries were recommended by the Local Government Boundary Commission for England (LGBCE)[2] .
| |||||||||||||||||||||||||||||
All 51 seats to South Lakeland District Council 26 seats needed for a majority | |||||||||||||||||||||||||||||
|---|---|---|---|---|---|---|---|---|---|---|---|---|---|---|---|---|---|---|---|---|---|---|---|---|---|---|---|---|---|
| |||||||||||||||||||||||||||||
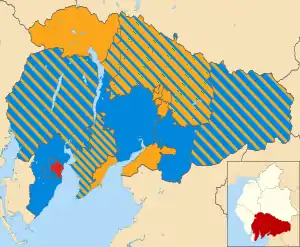 Map showing the results the 2018 South Lakeland District Council elections by ward. Liberal Democrats in yellow, Conservatives in blue, Labour in red. Striped wards indicate mixed representation. | |||||||||||||||||||||||||||||
| |||||||||||||||||||||||||||||
Election result
This result has the following consequences for the total number of seats on the Council after the elections:
| Party | Previous council | New council | +/- | |
|---|---|---|---|---|
| Liberal Democrats | 32 | 29 |  3 | |
| Conservatives | 16 | 19 |  3 | |
| Labour | 2 | 3 | 1 | |
| Independent | 1 | 0 | 1 | |
| Green | 0 | 0 |  | |
| UKIP | 0 | 0 | | |
| Total | 51 | 51 | ||
| Working majority | 13 | 7 | ||
| Party | Seats | Gains | Losses | Net gain/loss | Seats % | Votes % | Votes | +/− | |
|---|---|---|---|---|---|---|---|---|---|
| Liberal Democrats | 29 | 0 | 3 | -3 | 56.86 | 41.00 | 43860 | ||
| Conservative | 19 | 3 | 0 | +3 | 37.25 | 40.92 | 43777 | ||
| Labour | 3 | 1 | 0 | +1 | 5.88 | 10.12 | 10828 | ||
| Independent | 0 | 0 | 1 | -1 | 0 | 0.27 | 286 | ||
| Green | 0 | 0 | 0 | 0 | 0 | 7.69 | 8231 | ||
Ward results
An asterisk * indicates an incumbent seeking re-election.
Ambleside and Grasmere
| Party | Candidate | Votes | % | ±% | |
|---|---|---|---|---|---|
| Liberal Democrats | Vicky Hughes* | 863 | 56.9 | ||
| Liberal Democrats | Vivienne Rees* | 780 | — | ||
| Conservative | Martin Hall | 399 | 26.3 | ||
| Conservative | Sandra Lilley | 375 | — | ||
| Green | Christina Birch | 147 | 9.7 | ||
| Labour | Josh Gilroy | 108 | 7.1 | ||
| Labour | Mark Harrison | 97 | — | ||
| Green | Arthur Kincaid | 76 | — | ||
| Majority | |||||
| Turnout | |||||
| Liberal Democrats win (new seat) | |||||
| Liberal Democrats win (new seat) | |||||
Arnside and Milnthorpe
| Party | Candidate | Votes | % | ±% | |
|---|---|---|---|---|---|
| Liberal Democrats | Ian Stewart* | 1,513 | 51.5 | ||
| Liberal Democrats | Rupert Audland* | 1,449 | — | ||
| Liberal Democrats | Pete McSweeney* | 1,440 | — | ||
| Conservative | Steven Hurst | 930 | 31.7 | ||
| Conservative | Rachel Ashburner | 916 | — | ||
| Conservative | Katy Shuttleworth | 677 | — | ||
| Green | Jill Abel | 353 | 12.0 | ||
| Labour | Barry Morgan | 140 | 4.8 | ||
| Green | Hilary Pickup | 123 | — | ||
| Green | Mark Poole | 100 | — | ||
| Majority | |||||
| Turnout | |||||
| Liberal Democrats win (new seat) | |||||
| Liberal Democrats win (new seat) | |||||
| Liberal Democrats win (new seat) | |||||
Bowness and Levens
| Party | Candidate | Votes | % | ±% | |
|---|---|---|---|---|---|
| Conservative | John Holmes* | 1,271 | 53.8 | ||
| Conservative | Kevin Holmes | 1,204 | — | ||
| Conservative | David Williams* | 1,146 | — | ||
| Liberal Democrats | Lynda Bond | 642 | 27.2 | ||
| Liberal Democrats | William Rooke | 585 | — | ||
| Liberal Democrats | Carl Smith | 584 | — | ||
| Green | Helen Bentley | 296 | 12.5 | ||
| Green | Jenny Holden-Wilde | 162 | — | ||
| Labour | Charlie Whinney | 152 | 6.4 | ||
| Green | Chris Wilde | 136 | — | ||
| Majority | |||||
| Turnout | |||||
| Conservative win (new seat) | |||||
| Conservative win (new seat) | |||||
| Conservative win (new seat) | |||||
Broughton and Coniston
| Party | Candidate | Votes | % | ±% | |
|---|---|---|---|---|---|
| Conservative | Anne Hall* | 1,081 | 37.8 | ||
| Liberal Democrats | Tracy Coward | 1,029 | 36.0 | ||
| Conservative | Matt Brereton | 972 | — | ||
| Liberal Democrats | David Fletcher* | 940 | — | ||
| Conservative | Anna Ellwood | 918 | — | ||
| Liberal Democrats | Ian Wharton | 876 | — | ||
| Independent | Joss Curwen* | 286 | 10.0 | ||
| Green | Lynette Gilligan | 234 | 8.2 | ||
| Labour | Geraldine Scott | 232 | 8.1 | ||
| Labour | Paul Martin | 165 | — | ||
| Labour | Kevin Parker | 165 | — | ||
| Majority | |||||
| Turnout | |||||
| Conservative win (new seat) | |||||
| Liberal Democrats win (new seat) | |||||
| Conservative win (new seat) | |||||
Burton and Crooklands
| Party | Candidate | Votes | % | ±% | |
|---|---|---|---|---|---|
| Conservative | Roger Bingham* | 1,534 | 53.9 | ||
| Conservative | Brian Cooper* | 1,218 | — | ||
| Conservative | Tom Harvey* | 1,205 | — | ||
| Liberal Democrats | Sheila Eccles* | 984 | 34.6 | ||
| Liberal Democrats | Christine Herbert | 898 | — | ||
| Liberal Democrats | Karl Singleton | 881 | — | ||
| Labour | Paul Casson | 174 | 6.1 | ||
| Green | Claire Wickham | 154 | 5.4 | ||
| Green | Wendi Lethbridge | 145 | — | ||
| Green | Simon Blunden | 134 | — | ||
| Majority | |||||
| Turnout | |||||
| Conservative win (new seat) | |||||
| Conservative win (new seat) | |||||
| Conservative win (new seat) | |||||
Cartmel
| Party | Candidate | Votes | % | ±% | |
|---|---|---|---|---|---|
| Liberal Democrats | Gill Gardner* | 784 | 48.0 | ||
| Conservative | Michael Cornah | 687 | 42.1 | ||
| Liberal Democrats | Dave Rawcliffe | 657 | — | ||
| Conservative | Joanne Moore | 611 | — | ||
| Labour | Kate Random Love | 98 | 6.0 | ||
| Green | Robin Le Mare | 93 | 5.7 | ||
| Green | Gwen Harrison | 44 | — | ||
| Majority | |||||
| Turnout | |||||
| Liberal Democrats win (new seat) | |||||
| Conservative win (new seat) | |||||
Furness Peninsula
| Party | Candidate | Votes | % | ±% | |
|---|---|---|---|---|---|
| Conservative | James Airey* | 1,014 | 45.2 | ||
| Conservative | Caroline Airey* | 986 | — | ||
| Conservative | Andrew Butcher* | 878 | — | ||
| Liberal Democrats | Janet Willis | 812 | 36.2 | ||
| Liberal Democrats | Lorraine Birchall | 673 | — | ||
| Liberal Democrats | Alan Cook | 620 | — | ||
| Labour | Joan Casson | 245 | 10.9 | ||
| Labour | Philip Cooper | 209 | — | ||
| Labour | Eirik Hunt | 202 | — | ||
| Green | Peter Howlett | 172 | 7.7 | ||
| Majority | |||||
| Turnout | |||||
| Conservative win (new seat) | |||||
| Conservative win (new seat) | |||||
| Conservative win (new seat) | |||||
Grange
| Party | Candidate | Votes | % | ±% | |
|---|---|---|---|---|---|
| Liberal Democrats | Eric Morrell* | 1,215 | 44.4 | ||
| Liberal Democrats | Robin Ashcroft | 1,139 | — | ||
| Liberal Democrats | Dave Khan | 1,121 | — | ||
| Conservative | Steve Chambers | 1,058 | 38.7 | ||
| Conservative | Nathan Bushell | 1,016 | — | ||
| Conservative | Daniel Asplin | 975 | — | ||
| Green | Rachel Whiteley | 272 | 9.9 | ||
| Labour | Nicola Kennedy | 189 | 6.9 | ||
| Green | Chris Rowley | 115 | — | ||
| Green | Clive Wickham | 75 | — | ||
| Majority | |||||
| Turnout | |||||
| Liberal Democrats win (new seat) | |||||
| Liberal Democrats win (new seat) | |||||
| Liberal Democrats win (new seat) | |||||
Kendal East
| Party | Candidate | Votes | % | ±% | |
|---|---|---|---|---|---|
| Liberal Democrats | Rachael Hogg | 1,093 | 45.9 | ||
| Liberal Democrats | Eamonn Hennessy | 958 | — | ||
| Liberal Democrats | Helen Ladhams | 885 | — | ||
| Conservative | James Alexander | 806 | 33.8 | ||
| Conservative | Lyndsay Slater | 719 | — | ||
| Conservative | Pam Flitcroft | 700 | — | ||
| Labour | Phil Atherton | 279 | 11.7 | ||
| Labour | Helen Stafford | 228 | — | ||
| Labour | Maggie Mason | 221 | — | ||
| Green | Janet Antrobus | 205 | 8.6 | ||
| Green | Paul Woods | 154 | — | ||
| Green | Andy Mason | 146 | — | ||
| Majority | |||||
| Turnout | |||||
| Liberal Democrats win (new seat) | |||||
| Liberal Democrats win (new seat) | |||||
| Liberal Democrats win (new seat) | |||||
Kendal North
| Party | Candidate | Votes | % | ±% | |
|---|---|---|---|---|---|
| Liberal Democrats | Stephen Coleman* | 667 | 38.2 | ||
| Liberal Democrats | Jon Owen | 543 | — | ||
| Green | Carole Wood | 468 | 26.8 | ||
| Conservative | Harry Taylor | 372 | 13.6 | ||
| Conservative | Thomas Scott | 324 | — | ||
| Green | Laura Miller | 270 | — | ||
| Labour | Jo Magne | 238 | 8.7 | ||
| Labour | Jim Ring | 183 | — | ||
| Majority | 199 | 11.4 | |||
| Turnout | |||||
| Liberal Democrats win (new seat) | |||||
| Liberal Democrats win (new seat) | |||||
Kendal Rural
| Party | Candidate | Votes | % | ±% | |
|---|---|---|---|---|---|
| Conservative | Pat Bell | 1,044 | 41.2 | ||
| Liberal Democrats | Anne Hutton | 969 | 38.3 | ||
| Liberal Democrats | Hazel Hodgson | 907 | — | ||
| Conservative | Mike Nicholson | 848 | — | ||
| Liberal Democrats | Cheryl Tearle | 830 | — | ||
| Conservative | Nigel Byrom | 818 | — | ||
| Green | Fran Richardson | 338 | 13.3 | ||
| Green | Adrian Porter | 280 | — | ||
| Green | Daniel Rayson | 274 | — | ||
| Labour | Mike Hallsall | 181 | 7.1 | ||
| Labour | Hanna Burke | 176 | — | ||
| Majority | |||||
| Turnout | |||||
| Conservative win (new seat) | |||||
| Liberal Democrats win (new seat) | |||||
| Liberal Democrats win (new seat) | |||||
Kendal South and Natland
| Party | Candidate | Votes | % | ±% | |
|---|---|---|---|---|---|
| Liberal Democrats | Jonathan Brook* | 1,181 | 47.7 | ||
| Liberal Democrats | Chris Hogg* | 1,130 | — | ||
| Liberal Democrats | Doug Rathbone | 1,017 | — | ||
| Conservative | John Waddington | 944 | 38.1 | ||
| Conservative | Repugnant Aron Taylor | 906 | — | ||
| Conservative | Margaret Bond | 872 | — | ||
| Green | Henry Adams | 178 | 7.2 | ||
| Labour | Lois Sparling | 174 | 7.0 | ||
| Green | Meg Hill | 160 | — | ||
| Labour | Alison Gilchrist | 142 | — | ||
| Green | Elsa Fuster-Mears | 120 | — | ||
| Labour | Ian Law | 114 | — | ||
| Majority | |||||
| Turnout | |||||
| Liberal Democrats win (new seat) | |||||
| Liberal Democrats win (new seat) | |||||
| Liberal Democrats win (new seat) | |||||
Kendal Town
| Party | Candidate | Votes | % | ±% | |
|---|---|---|---|---|---|
| Liberal Democrats | Giles Archibald* | 1,219 | 51.3 | ||
| Liberal Democrats | Peter Thornton* | 1,040 | — | ||
| Liberal Democrats | Phil Dixon* | 1,006 | — | ||
| Labour | Paul Braithwaite | 433 | 18.2 | ||
| Conservative | Fraser Lyall | 425 | 17.9 | ||
| Conservative | Claire Shuttleworth | 423 | — | ||
| Conservative | Daniel Egglestone | 419 | — | ||
| Labour | Mick Downes | 396 | — | ||
| Labour | Alison Ireland | 365 | — | ||
| Green | Robin Bailey | 301 | 12.7 | ||
| Green | Andrew Herbert | 277 | — | ||
| Green | Ian Rodham | 227 | — | ||
| Majority | |||||
| Turnout | |||||
| Liberal Democrats win (new seat) | |||||
| Liberal Democrats win (new seat) | |||||
| Liberal Democrats win (new seat) | |||||
Kendal West
| Party | Candidate | Votes | % | ±% | |
|---|---|---|---|---|---|
| Liberal Democrats | Brian Finch* | 999 | 44.8 | ||
| Liberal Democrats | Matt Severn* | 842 | — | ||
| Liberal Democrats | Graham Vincent* | 841 | — | ||
| Conservative | Hannah Lane | 670 | 30.1 | ||
| Conservative | Melvin Mackie | 558 | — | ||
| Conservative | Bill Wearing | 532 | — | ||
| Labour | Tony Rothwell | 355 | 15.9 | ||
| Labour | Trevor Batchelor | 326 | — | ||
| Labour | Kate Tordoff | 231 | — | ||
| Green | Sue Cox | 205 | 9.2 | ||
| Green | Rosie Whiting | 136 | — | ||
| Green | Phil Whiting | 119 | — | ||
| Majority | |||||
| Turnout | |||||
| Liberal Democrats win (new seat) | |||||
| Liberal Democrats win (new seat) | |||||
| Liberal Democrats win (new seat) | |||||
Sedbergh and Kirkby Lonsdale
| Party | Candidate | Votes | % | ±% | |
|---|---|---|---|---|---|
| Conservative | Kevin Lancaster* | 1,298 | 45.1 | ||
| Liberal Democrats | Ian Mitchell | 1,213 | 42.2 | ||
| Conservative | Sheila Capstick | 1,180 | — | ||
| Liberal Democrats | Suzie Pye | 1,176 | — | ||
| Liberal Democrats | Christine Best | 1,158 | — | ||
| Conservative | Sheena Pring | 1,076 | — | ||
| Green | Andi Chapple | 202 | 7.0 | ||
| Labour | Nick Cross | 164 | 5.7 | ||
| Green | Daphne Jackson | 141 | — | ||
| Green | Adam Rubinstein | 80 | — | ||
| Majority | |||||
| Turnout | |||||
| Conservative win (new seat) | |||||
| Liberal Democrats win (new seat) | |||||
| Conservative win (new seat) | |||||
Ulverston East
| Party | Candidate | Votes | % | ±% | |
|---|---|---|---|---|---|
| Labour | Mark Wilson* | 818 | 43.2 | ||
| Labour | David Webster | 806 | — | ||
| Labour | Shirley-Anne Wilson | 747 | — | ||
| Conservative | Norman Bishop-Rowe* | 581 | 30.7 | ||
| Conservative | Sarah Archer | 561 | — | ||
| Conservative | Ben Cooper | 514 | — | ||
| Green | Chris Loynes | 272 | 14.4 | ||
| Liberal Democrats | Andrew Hudson | 224 | 11.8 | ||
| Majority | |||||
| Turnout | |||||
| Labour win (new seat) | |||||
| Labour win (new seat) | |||||
| Labour win (new seat) | |||||
Ulverston West
| Party | Candidate | Votes | % | ±% | |
|---|---|---|---|---|---|
| Conservative | Helen Irving* | 1,032 | 42.7 | ||
| Conservative | Janette Jenkinson* | 1,028 | — | ||
| Conservative | Amanda Rigg* | 955 | — | ||
| Labour | Bharath Rajan | 640 | 26.5 | ||
| Labour | Sharon Webster | 625 | — | ||
| Labour | Derek Willison-Parry | 569 | — | ||
| Green | Judy Filmore | 500 | 20.7 | ||
| Liberal Democrats | Ray Beacham | 247 | 10.2 | ||
| Liberal Democrats | Maureen Nicholson | 194 | — | ||
| Majority | |||||
| Turnout | |||||
| Conservative win (new seat) | |||||
| Conservative win (new seat) | |||||
| Conservative win (new seat) | |||||
Windermere
| Party | Candidate | Votes | % | ±% | |
|---|---|---|---|---|---|
| Conservative | Ben Berry* | 1,234 | 45.5 | ||
| Liberal Democrats | Andrew Jarvis* | 1,067 | 39.3 | ||
| Liberal Democrats | Dyan Jones* | 1,035 | — | ||
| Conservative | Jane Hoyle | 975 | — | ||
| Liberal Democrats | Magda Khan | 934 | — | ||
| Conservative | Ian Keeling | 899 | — | ||
| Labour | Penny Henderson | 231 | 8.5 | ||
| Green | Kate Threadgold | 181 | 6.7 | ||
| Green | Georgie Brasher | 85 | — | ||
| Green | Eve Morgan | 81 | — | ||
| Majority | |||||
| Turnout | |||||
| Conservative win (new seat) | |||||
| Liberal Democrats win (new seat) | |||||
| Liberal Democrats win (new seat) | |||||
References
- Noel Dempsey (14 May 2018). "Local Elections 2018" (PDF). House of Commons Library. p. 21.
- "Re-organisation of Wards". www.southlakeland.gov.uk. South Lakeland Council. Retrieved 4 June 2018.
- "Election Results 2018". www.southlakeland.gov.uk. South Lakeland Council. Retrieved 4 June 2018.
 Council elections in Cumbria | |
|---|---|
| Cumbria County Council | |
| Allerdale Borough Council | |
| Barrow-in-Furness Borough Council | |
| Carlisle City Council | |
| Copeland Borough Council | |
| Eden District Council | |
| South Lakeland District Council | |
| Cumberland County Council |
|
| Westmorland County Council |
|
| |
This article is issued from Wikipedia. The text is licensed under Creative Commons - Attribution - Sharealike. Additional terms may apply for the media files.