2005 North Rhine-Westphalia state election
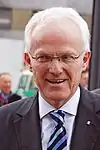
The 2005 North Rhine-Westphalia state election was held on 22 May 2005 to elect the members of the Landtag of North Rhine-Westphalia. The incumbent coalition government of the Social Democratic Party (SPD) and The Greens led by Minister-President Peer Steinbrück was defeated. The Christian Democratic Union (CDU) became the largest party and formed a coalition with the Free Democratic Party (FDP). CDU leader Jürgen Rüttgers was subsequently elected Minister-President. This marked the first period of non-SPD government in the state since 1966.
 | |||||||||||||||||||||||||||||||||||||||||||||||||||||||||||
All 187 seats of the Landtag of North Rhine-Westphalia 94 seats needed for a majority | |||||||||||||||||||||||||||||||||||||||||||||||||||||||||||
|---|---|---|---|---|---|---|---|---|---|---|---|---|---|---|---|---|---|---|---|---|---|---|---|---|---|---|---|---|---|---|---|---|---|---|---|---|---|---|---|---|---|---|---|---|---|---|---|---|---|---|---|---|---|---|---|---|---|---|---|
| Turnout | 8,244,014 (63.0%) 6.3% | ||||||||||||||||||||||||||||||||||||||||||||||||||||||||||
| |||||||||||||||||||||||||||||||||||||||||||||||||||||||||||
| |||||||||||||||||||||||||||||||||||||||||||||||||||||||||||



Campaign and issues
Leading up to the election, the state was governed by a coalition of the SPD and the Greens, with Peer Steinbrück as Minister-President.
For much of 2004, there had been speculation that if the opposition Christian Democratic Union were to win this election, they would gain a two-thirds majority in the national upper house, the Bundesrat, and force a new election for the Bundestag by making the country ungovernable for Gerhard Schröder's coalition. Following the CDU's loss of a majority in Saxony, this risk was alleviated; however, North Rhine-Westphalia had been governed by the SPD alone or in coalition since 1966, so a defeat there would be perceived as a grave blow to the SPD.
Leading up to the election, polling in the state indicated a consistent lead (from 5-11% depending on agency) for a coalition of the CDU and the FDP over the SPD-Green share. In general, high German unemployment and the unpopularity of the national SPD and the Hartz IV reforms appeared to have taken a toll. Polls did indicate that SPD state leader Steinbrück was personally more popular than CDU state leader Jürgen Rüttgers, though.
This election marked the debut of Labour and Social Justice – The Electoral Alternative, a left-wing party including many former SPD members who opposed perceived neoliberalism within the federal Schröder government.
Parties
The table below lists parties represented in the previous Landtag of North Rhine-Westphalia.
| Name | Ideology | Leader(s) | 2000 result | |||
|---|---|---|---|---|---|---|
| Votes (%) | Seats | |||||
| SPD | Social Democratic Party of Germany Sozialdemokratische Partei Deutschlands |
Social democracy | Peer Steinbrück | 42.8% | 102 / 231 | |
| CDU | Christian Democratic Union of Germany Christlich Demokratische Union Deutschlands |
Christian democracy | Jürgen Rüttgers | 37.0% | 88 / 231 | |
| FDP | Free Democratic Party Freie Demokratische Partei |
Classical liberalism | Andreas Pinkwart | 9.8% | 24 / 231 | |
| Grüne | Alliance 90/The Greens Bündnis 90/Die Grünen |
Green politics | Bärbel Höhn | 7.1% | 17 / 231 | |
Opinion polling
| Polling firm | Fieldwork date | Sample size |
SPD | CDU | FDP | Grüne | WASG | Others | Lead |
|---|---|---|---|---|---|---|---|---|---|
| 2005 state election | 22 May 2005 | – | 37.1 | 44.8 | 6.2 | 6.2 | 2.2 | 3.5 | 7.7 |
| Forsa | 18 May 2005 | 1,326 | 36 | 43 | 7 | 7 | – | 7 | 7 |
| Infratest dimap | 12–13 May 2005 | 1,000 | 37 | 43 | 7.5 | 7.5 | – | 5 | 6 |
| Infas | 10–12 May 2005 | 750 | 36 | 43 | 8 | 7 | – | 6 | 7 |
| Forschungsgruppe Wahlen | 9–12 May 2005 | 1,062 | 35 | 44 | 7 | 9 | – | 5 | 9 |
| Infratest dimap | 10–11 May 2005 | 1,000 | 37 | 43 | 7 | 8 | 2 | 3 | 6 |
| Forsa | 26 Apr–6 May 2005 | 1,017 | 34 | 45 | 7 | 7 | 2 | 5 | 11 |
| Infratest dimap | 2–3 May 2005 | 1,010 | 35 | 45 | 7 | 8 | – | 5 | 10 |
| Emnid | 3 May 2005 | ? | 34 | 44 | 7 | 9 | 2 | 4 | 10 |
| Forsa | 25–29 Apr 2005 | 1,109 | 35 | 45 | 7 | 7 | 2 | 4 | 10 |
| Infratest dimap | 26–28 Apr 2005 | 1,000 | 34 | 45 | 7 | 9 | – | 5 | 11 |
| Emnid | 26 Apr 2005 | 1,000 | 34 | 45 | 6 | 10 | – | 5 | 11 |
| Emnid | 29 Mar–18 Apr 2005 | 1,053 | 35 | 45 | 6 | 9 | – | 5 | 10 |
| Infratest dimap | 12–14 Apr 2005 | 1,000 | 35 | 45 | 7 | 8 | – | 5 | 10 |
| Forschungsgruppe Wahlen | 5–7 Apr 2005 | 1,039 | 36 | 46 | 6 | 8 | – | 4 | 10 |
| Infratest dimap | 4–5 Apr 2005 | 1,000 | 34 | 45 | 7 | 9 | – | 5 | 11 |
| Emnid | 24 Mar–3 Apr 2005 | 1,063 | 35 | 45 | 7 | 9 | – | 4 | 10 |
| Forsa | 30 Mar–5 Apr 2005 | 1,009 | 36 | 45 | 5 | 8 | – | 5 | 9 |
| Infratest dimap | 15–17 Mar 2005 | 1,000 | 35 | 42 | 7 | 10 | 1 | 5 | 7 |
| Emnid | 2–14 Mar 2005 | 1,058 | 35 | 43 | 7 | 10 | – | 5 | 8 |
| Infratest dimap | 1–3 Mar 2005 | 1,000 | 35 | 43 | 7 | 9 | – | 6 | 8 |
| Forsa | 21 Feb–1 Mar 2005 | 1,012 | 36 | 42 | 7 | 9 | – | 6 | 6 |
| Infratest dimap | 9–10 Feb 2005 | 1,000 | 37 | 39 | 7 | 9 | – | 8 | 2 |
| Forsa | 10–12 Jan 2005 | 1,302 | 39 | 39 | 7 | 9 | – | 6 | Tie |
| Infratest dimap | 4–6 Jan 2005 | 1,010 | 38 | 40 | 7 | 10 | – | 5 | 2 |
| Emnid | 3 Dec 2004 | 1,000 | 33 | 40 | 8 | 13 | – | 6 | 7 |
| Forsa | 2 Dec 2004 | ? | 36 | 39 | 8 | 11 | – | 6 | 3 |
| Infratest dimap | 29 Oct–4 Nov 2004 | 1,075 | 36 | 40 | 8 | 11 | – | 5 | 4 |
| Infratest dimap | 13–15 Sep 2004 | 1,000 | 30 | 43 | 7 | 13 | – | 7 | 13 |
| Emnid | 8–9 Sep 2004 | 1,000 | 30 | 43 | 7 | 11 | – | 9 | 13 |
| Infratest dimap | 24–26 Aug 2004 | 1,000 | 32 | 42 | 7 | 12 | 3 | 4 | 10 |
| Emnid | 9 Aug 2004 | 1,000 | 28 | 44 | 8 | 12 | – | 8 | 16 |
| Psephos | 31 May–4 Jun 2004 | 1,000 | 33 | 47 | 6 | 10 | – | 4 | 14 |
| Forschungsgruppe Wahlen | 24 Apr 2004 | ? | 29 | 49 | 5 | 12 | – | 5 | 20 |
| Psephos | 18 Apr 2004 | 1,003 | 34 | 47 | 7 | 8 | – | 4 | 13 |
| dimap | 2–8 Mar 2004 | 1,007 | 32 | 48 | 6 | 10 | – | 4 | 16 |
| dimap | 20–25 Jan 2004 | 1,001 | 32 | 48 | 8 | 9 | – | 3 | 16 |
| dimap | 19 Jan 2004 | ? | 33 | 48 | 7 | 8 | – | 4 | 15 |
| Psephos | 2 Nov 2003 | ? | 31 | 47 | 7 | 10 | – | 5 | 16 |
| dimap | 30 Sep–2 Oct 2003 | 1,050 | 34 | 47 | 6 | 10 | – | 3 | 13 |
| Infratest dimap | 1 Jul 2003 | 1,000 | 33 | 47 | 7 | 10 | – | 3 | 14 |
| Emnid | 13 Jun 2003 | ? | 36 | 45 | 6 | 10 | – | 3 | 9 |
| Forsa | 26–30 May 2003 | 1,508 | 37 | 45 | 6 | 9 | – | 3 | 8 |
| Infratest dimap | 26–27 May 2003 | 1,000 | 33 | 45 | 8 | 11 | – | 3 | 12 |
| dimap | 19 May 2003 | 1,005 | 32 | 48 | 7 | 9 | – | 4 | 16 |
| dimap | 11–14 Mar 2003 | 1,000 | 33 | 48 | 6 | 10 | – | 3 | 15 |
| Psephos | 9 Feb 2003 | 1,005 | 33 | 46 | 8 | 10 | – | 3 | 7 |
| Emnid | 9–14 Jan 2003 | 1,000 | 36 | 45 | 6 | 9 | – | 4 | 9 |
| Psephos | 10 Nov 2002 | ? | 39 | 43 | 8 | 7 | – | 3 | 4 |
| Psephos | 15 Apr 2002 | ? | 36 | 38 | 12 | 8 | – | 6 | 2 |
| Psephos | 20 Jan 2002 | ? | 39 | 41 | 10 | 6 | – | 4 | 2 |
| Psephos | 30 Sep 2001 | ? | 43 | 38 | 10 | 6 | – | 3 | 5 |
| Psephos | 13 May 2001 | ? | 44 | 35 | 11 | 7 | – | 3 | 9 |
| Psephos | 14 Jan 2001 | ? | 41 | 38 | 9 | 8 | – | 4 | 3 |
| 2000 state election | 14 May 2000 | – | 42.8 | 37.0 | 9.8 | 7.1 | – | 3.3 | 5.8 |
Election result
Summary of the 22 May 2005 election results for the Landtag of North Rhine-Westphalia
| Party | Votes | % | +/- | Seats | +/- | Seats % | |
|---|---|---|---|---|---|---|---|
| Christian Democratic Union (CDU) | 3,696,506 | 44.8 | 7.8 |
89 | 1 |
47.6 | |
| Social Democratic Party (SPD) | 3,058,988 | 37.1 |  5.7 |
74 | 28 |
39.6 | |
| Alliance 90/The Greens (Grüne) | 509,293 | 6.2 | 0.8 |
12 | 5 |
6.4 | |
| Free Democratic Party (FDP) | 508,266 | 6.2 | 3.6 |
12 | 12 |
6.4 | |
| Labour and Social Justice – The Electoral Alternative (WASG) | 181,988 | 2.2 | New | 0 | New | 0 | |
| National Democratic Party (NPD) | 73,969 | 0.9 | 0.9 |
0 | ±0 | 0 | |
| Party of Democratic Socialism (PDS) | 72,989 | 0.9 | 0.2 |
0 | ±0 | 0 | |
| The Republicans (REP) | 67,220 | 0.8 | 0.3 |
0 | ±0 | 0 | |
| Others | 74,795 | 0.9 | 0 | ±0 | 0 | ||
| Total | 8,244,014 | 100.0 | 187 | 44 |
|||
| Voter turnout | 63.0 | 6.3 |
|||||
Sources
References
 |
Wikimedia Commons has media related to North Rhine-Westphalia state election, 2005. |
| State elections | |
|---|---|
| Local elections |
|
| |