1999 Bath and North East Somerset Council election
Elections were held on 6 May 1999 to elect 65 local councillors for Bath and North East Somerset Council, the second election for the council. The results are show below. After the election, a minority Liberal Democrat administration was formed.
| |||||||||||||||||||||||||||||||||||||||||||||||||||||
All 65 seats to Bath and North East Somerset Council 33 seats needed for a majority | |||||||||||||||||||||||||||||||||||||||||||||||||||||
|---|---|---|---|---|---|---|---|---|---|---|---|---|---|---|---|---|---|---|---|---|---|---|---|---|---|---|---|---|---|---|---|---|---|---|---|---|---|---|---|---|---|---|---|---|---|---|---|---|---|---|---|---|---|
| |||||||||||||||||||||||||||||||||||||||||||||||||||||
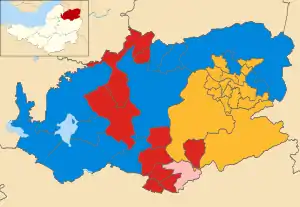 Map showing the composition of Bath and North East Somerset Council following the election. Blue showing Conservative, Red showing Labour, Yellow showing Liberal Democrats, and Grey showing Independents. Striped wards have mixed representation. | |||||||||||||||||||||||||||||||||||||||||||||||||||||
| |||||||||||||||||||||||||||||||||||||||||||||||||||||
Election results
| Bath and North East Somerset Council election, 1999 | |||||||||||||||
|---|---|---|---|---|---|---|---|---|---|---|---|---|---|---|---|
| Party | Candidates | Votes | |||||||||||||
| Stood | Elected | Gained | Unseated | Net | % of total | % | No. | Net % | |||||||
| Liberal Democrats | 65 | 30 | – | – |  3 |
46.2% | 40.3% | 34,564 | 4.1% | ||||||
| Labour | 65 | 17 | – | – |  5 |
26.2% | 27.3% | 23,394 | 5.9% | ||||||
| Conservative | 56 | 16 | – | – |  |
24.6% | 29.8% | 25,583 | 0.6% | ||||||
| Independent Labour | 2 | 2 | – | – | 2 |
3.1% | 1.4% | 1,198 | N/A | ||||||
| Independent | 6 | 0 | – | – | – | 0% | 0.7% | 624 | 0.1% | ||||||
| Green | 3 | 0 | – | – | – | 0% | 0.5% | 406 | 0.1% | ||||||
Ward results
The ward results listed below are based on the changes from the 1995 elections where boundary changes have not taken place, not taking into account any party defections or by-elections. Sitting councillors are marked with an asterisk (*).
Abbey
| Party | Candidate | Votes | % | ±% | |
|---|---|---|---|---|---|
| Liberal Democrats | Victoria Kilroy * | 719 | 48.3 | +2.8 | |
| Liberal Democrats | Agnes Melling * | 668 | – | ||
| Conservative | Sir Elgar Jenkins | 530 | 35.6 | +2.5 | |
| Conservative | Michael Hobbins | 525 | – | ||
| Labour | Gael Doswell | 134 | 9.0 | –9.3 | |
| Labour | James Anthony Walsh | 110 | – | ||
| Independent | Ian Rae Callender Harris | 105 | – | ||
| Independent | Margaret Marion Stewart | 60 | – | ||
| Independent | Graham Alexander Vincent Hooker | 47 | – | ||
| Turnout | 34.9 | ||||
| Registered electors | 4,333 | ||||
| Liberal Democrats hold | Swing | ||||
| Liberal Democrats hold | Swing | ||||
Bathavon North
| Party | Candidate | Votes | % | ±% | |
|---|---|---|---|---|---|
| Conservative | William Anthony Cox * | 1,056 | 53.4 | +6.8 | |
| Conservative | Ian Dewey * | 1,040 | – | ||
| Conservative | Esme Gladys Miles * | 955 | – | ||
| Liberal Democrats | Christopher John Baxter | 575 | 29.1 | +1.8 | |
| Liberal Democrats | Jane Bridget Di Marco | 561 | – | ||
| Liberal Democrats | Clive Alan Whitemore | 528 | – | ||
| Labour | David Walter Lavington | 348 | 17.6 | –8.5 | |
| Labour | Hendrik Bebber | 293 | – | ||
| Labour | Anna Beria | 252 | – | ||
| Turnout | 36.0 | ||||
| Registered electors | 5,704 | ||||
| Conservative hold | Swing | ||||
| Conservative hold | Swing | ||||
| Conservative hold | Swing | ||||
Bathavon South
| Party | Candidate | Votes | % | ±% | |
|---|---|---|---|---|---|
| Liberal Democrats | Gitte Dawson | 606 | 62.1 | ||
| Conservative | Owain Maredydd Rhys | 279 | 28.6 | ||
| Labour | Gareth James Mills | 91 | 9.3 | ||
| Majority | 327 | 33.5 | |||
| Turnout | 46.0 | ||||
| Registered electors | 2,129 | ||||
| Liberal Democrats win (new seat) | |||||
Bathavon West
| Party | Candidate | Votes | % | ±% | |
|---|---|---|---|---|---|
| Liberal Democrats | Rosemary Rea Todd | 412 | 58.6 | ||
| Conservative | Harvey Nicholas Haeberling | 186 | 26.5 | ||
| Labour | David Turvey | 105 | 14.9 | ||
| Majority | 226 | 32.1 | |||
| Turnout | 37.1 | ||||
| Registered electors | 1,899 | ||||
| Liberal Democrats win (new seat) | |||||
Bathwick
| Party | Candidate | Votes | % | ±% | |
|---|---|---|---|---|---|
| Conservative | John Anthony Bailey * | 571 | 59.3 | +11.9 | |
| Conservative | Martin Robert Sykes | 529 | – | ||
| Liberal Democrats | Lynn Walker Stewart | 323 | 33.5 | +5.6 | |
| Liberal Democrats | Alan Sykes | 275 | – | ||
| Labour | Robert John Miles | 69 | 7.2 | –2.4 | |
| Labour | Diane Julie Mynors | 62 | – | ||
| Turnout | 26.6 | ||||
| Registered electors | 3,540 | ||||
| Conservative hold | Swing | ||||
| Conservative hold | Swing | ||||
Chew Valley North
| Party | Candidate | Votes | % | ±% | |
|---|---|---|---|---|---|
| Conservative | Malcolm Hanney * | 533 | 72.6 | ||
| Labour | Benjamin Guy Phillips | 122 | 16.6 | ||
| Liberal Democrats | David Alexander Knapton | 79 | 10.8 | ||
| Majority | 411 | 56.0 | |||
| Turnout | 40.0 | ||||
| Registered electors | 1,837 | ||||
| Conservative win (new seat) | |||||
Chew Valley South
| Party | Candidate | Votes | % | ±% | |
|---|---|---|---|---|---|
| Conservative | Vic Pritchard * | 423 | 58.8 | +6.0 | |
| Labour | Wayne Teall | 160 | 22.3 | –6.1 | |
| Liberal Democrats | Markus Gintas Sova | 136 | 18.9 | +0.1 | |
| Majority | 263 | 36.6 | +12.2 | ||
| Turnout | 42.2 | ||||
| Registered electors | 1,711 | ||||
| Conservative hold | Swing | ||||
Clutton
| Party | Candidate | Votes | % | ±% | |
|---|---|---|---|---|---|
| Labour | Robin Coombe Nicoll | 357 | 46.8 | ||
| Conservative | Audrey Jennifer Telling | 304 | 39.8 | ||
| Liberal Democrats | Alastair Derek Moss Bromhall | 102 | 13.4 | ||
| Majority | 53 | 6.9 | |||
| Turnout | 39.5 | ||||
| Registered electors | 1,933 | ||||
| Labour win (new seat) | |||||
Combe Down
| Party | Candidate | Votes | % | ±% | |
|---|---|---|---|---|---|
| Liberal Democrats | Jeffrey Stephen Manning * | 1,056 | 49.5 | +1.1 | |
| Liberal Democrats | Roger Symonds * | 1,007 | – | ||
| Conservative | Leila Margaret Wishart | 680 | 31.9 | –8.7 | |
| Conservative | Alan Robert Garrett | 528 | – | ||
| Independent | Jill Attwood | 298 | – | ||
| Labour | Robert John Hicks | 100 | 4.7 | –6.4 | |
| Labour | John Edgar Thackwell | 86 | – | ||
| Turnout | 49.6 | ||||
| Registered electors | 4,041 | ||||
| Liberal Democrats win (new seat) | |||||
| Liberal Democrats win (new seat) | |||||
Farmborough
| Party | Candidate | Votes | % | ±% | |
|---|---|---|---|---|---|
| Conservative | Sally Davis | 538 | 56.5 | ||
| Labour | Lawrence Hunt | 308 | 32.4 | ||
| Liberal Democrats | Andrew Bryce Halliday | 106 | 11.1 | ||
| Majority | 230 | 24.2 | |||
| Turnout | 47.1 | ||||
| Registered electors | 2,028 | ||||
| Conservative win (new seat) | |||||
High Littleton
| Party | Candidate | Votes | % | ±% | |
|---|---|---|---|---|---|
| Conservative | Les Kew | 389 | 48.7 | ||
| Labour | Christopher James Alford May | 315 | 39.5 | ||
| Liberal Democrats | Jocelyn Marion Clark | 94 | 11.8 | ||
| Majority | 74 | 9.3 | |||
| Turnout | 36.6 | ||||
| Registered electors | 2,183 | ||||
| Conservative win (new seat) | |||||
Keynsham East
| Party | Candidate | Votes | % | ±% | |
|---|---|---|---|---|---|
| Conservative | Bryan Organ * | 798 | 44.5 | +1.5 | |
| Conservative | Leslie George Sell * | 770 | – | ||
| Liberal Democrats | Jeanne Barbara Pinkerton | 736 | 41.0 | +1.5 | |
| Liberal Democrats | Mark Steven Cole | 730 | – | ||
| Labour | Graham Hobbs | 261 | 14.5 | –3.0 | |
| Labour | Christopher Francis Penn | 233 | – | ||
| Turnout | 42.0 | ||||
| Registered electors | 4,477 | ||||
| Conservative hold | Swing | ||||
| Conservative hold | Swing | ||||
Keynsham North
| Party | Candidate | Votes | % | ±% | |
|---|---|---|---|---|---|
| Labour | James Alfred Lingard * | 638 | 41.6 | ||
| Labour | Julie Stiddard * | 621 | – | ||
| Liberal Democrats | Keith Kirwan | 564 | 36.8 | ||
| Liberal Democrats | Hazel Jean Pratley | 430 | – | ||
| Conservative | Margaret Rose Brewer | 332 | 21.6 | ||
| Conservative | Patricia Joy Wood | 292 | – | ||
| Turnout | 38.1 | ||||
| Registered electors | 3,983 | ||||
| Labour win (new seat) | |||||
| Labour win (new seat) | |||||
Keynsham South
| Party | Candidate | Votes | % | ±% | |
|---|---|---|---|---|---|
| Labour | Adrian Inker * | 1,627 | 67.2 | +7.0 | |
| Labour | Sheila Mary Bateman * | 1,559 | – | ||
| Liberal Democrats | Christine Helen Kirwan | 499 | 20.6 | +5.1 | |
| Liberal Democrats | David Michael Usher | 349 | – | ||
| Conservative | Antoni Victor Pielesz | 295 | 12.2 | –8.3 | |
| Turnout | 36.7 | ||||
| Registered electors | 3,998 | ||||
| Labour hold | Swing | ||||
| Labour hold | Swing | ||||
Kingsmead
| Party | Candidate | Votes | % | ±% | |
|---|---|---|---|---|---|
| Liberal Democrats | Andrew Furse | 652 | 46.7 | +12.0 | |
| Liberal Democrats | Gerry Curran * | 634 | – | ||
| Conservative | David Hawkins * | 528 | 37.8 | +3.4 | |
| Conservative | Elizabeth Ann Newnham | 508 | – | ||
| Labour | Margaret Ann Burrows | 217 | 15.5 | –15.4 | |
| Labour | Julia Ann Thomas | 169 | – | ||
| Turnout | 33.3 | ||||
| Registered electors | 4,239 | ||||
| Liberal Democrats hold | Swing | ||||
| Liberal Democrats gain from Conservative | Swing | ||||
Lambridge
| Party | Candidate | Votes | % | ±% | |
|---|---|---|---|---|---|
| Liberal Democrats | Ramon David Cliffe * | 847 | 48.5 | +0.5 | |
| Liberal Democrats | Michael James Kelleher * | 786 | – | ||
| Conservative | Neville Paul Morgan | 588 | 33.7 | +3.0 | |
| Conservative | George Patrick Somers-Hall | 553 | – | ||
| Labour | Bernard William Morgan | 261 | 14.9 | –6.4 | |
| Labour | Timothy Edwin Pearce | 196 | – | ||
| Independent | Susan Mary Johnston | 50 | – | ||
| Turnout | 42.0 | ||||
| Registered electors | 4,103 | ||||
| Liberal Democrats hold | Swing | ||||
| Liberal Democrats hold | Swing | ||||
Lansdown
| Party | Candidate | Votes | % | ±% | |
|---|---|---|---|---|---|
| Conservative | Alison McNair | 800 | 57.3 | +15.2 | |
| Conservative | Richard Robin Wilmington | 757 | – | ||
| Liberal Democrats | Mary Geraldine Shelia Finch | 446 | 31.9 | –12.1 | |
| Liberal Democrats | Michael Jeffrey Williams | 416 | – | ||
| Labour | Robert John Fraser | 150 | 10.7 | –3.2 | |
| Labour | Grenville Malcolm John Young | 118 | – | ||
| Turnout | 36.4 | ||||
| Registered electors | 3,792 | ||||
| Conservative hold | Swing | ||||
| Conservative gain from Liberal Democrats | Swing | ||||
Lyncombe
| Party | Candidate | Votes | % | ±% | |
|---|---|---|---|---|---|
| Liberal Democrats | Ann Harding * | 1,215 | 60.4 | +11.1 | |
| Liberal Democrats | Marian McNeir * | 1,109 | – | ||
| Conservative | Brian James Hamlen | 618 | 30.7 | –5.8 | |
| Conservative | George Henry Hall | 602 | – | ||
| Labour | Roger John Jones | 177 | 8.8 | –5.3 | |
| Labour | Michael George Arthur Wheeler | 161 | – | ||
| Turnout | 48.4 | ||||
| Registered electors | 4,111 | ||||
| Liberal Democrats hold | Swing | ||||
| Liberal Democrats hold | Swing | ||||
Mendip
| Party | Candidate | Votes | % | ±% | |
|---|---|---|---|---|---|
| Conservative | Thomas Fletcher Rees-Mogg * | 363 | 47.0 | ||
| Labour | Harriet Joy Ajderian | 306 | 39.6 | ||
| Liberal Democrats | Gillian Dorothy Dunkerley | 103 | 13.3 | ||
| Majority | 57 | 7.4 | |||
| Turnout | 37.8 | ||||
| Registered electors | 2,045 | ||||
| Conservative win (new seat) | |||||
Midsomer Norton North
| Party | Candidate | Votes | % | ±% | |
|---|---|---|---|---|---|
| Labour | Alan Edward John French * | 680 | 63.7 | +5.8 | |
| Labour | Gordon Arthur Derrick * | 617 | – | ||
| Conservative | Ronald Abram | 201 | 18.8 | –4.9 | |
| Liberal Democrats | Patricia Clements | 187 | 17.5 | –0.9 | |
| Liberal Democrats | Rosalind Dawn Smallwood | 141 | – | ||
| Turnout | 25.5 | ||||
| Registered electors | 3,989 | ||||
| Labour hold | Swing | ||||
| Labour hold | Swing | ||||
Midsomer Norton Redfield
| Party | Candidate | Votes | % | ±% | |
|---|---|---|---|---|---|
| Labour | Betty May Perry * | 703 | 58.9 | –8.9 | |
| Labour | Derek John Herod * | 613 | – | ||
| Conservative | Shelia Daphne Green | 309 | 25.9 | +6.8 | |
| Liberal Democrats | Gillian Rosme Roberts | 182 | 15.2 | +2.1 | |
| Liberal Democrats | Philip Henry Vernon Vine | 146 | – | ||
| Turnout | 29.0 | ||||
| Registered electors | 3,949 | ||||
| Labour hold | Swing | ||||
| Labour hold | Swing | ||||
Newbridge
| Party | Candidate | Votes | % | ±% | |
|---|---|---|---|---|---|
| Liberal Democrats | Loraine Brinkhurst * | 1,048 | 61.7 | +17.8 | |
| Liberal Democrats | Caroline Roberts * | 983 | – | ||
| Conservative | John Doran | 463 | 27.3 | –6.1 | |
| Conservative | Jeffrey Higgins | 444 | – | ||
| Labour | Stephen Richards | 188 | 11.1 | –11.7 | |
| Labour | Andrew Cork | 169 | – | ||
| Turnout | 40.0 | ||||
| Registered electors | 4,327 | ||||
| Liberal Democrats hold | Swing | ||||
| Liberal Democrats hold | Swing | ||||
Odd Down
| Party | Candidate | Votes | % | ±% | |
|---|---|---|---|---|---|
| Liberal Democrats | Steve Hedges | 880 | 61.0 | ||
| Liberal Democrats | Nigel Roberts * | 829 | – | ||
| Labour | Thomas Doughty | 348 | 24.1 | ||
| Labour | Dennis Chales Nicoll | 333 | – | ||
| Conservative | Audrey Archer | 214 | 14.8 | ||
| Conservative | Jeremy Cecil Patterson-Fox | 194 | – | ||
| Turnout | 37.1 | ||||
| Registered electors | 3,952 | ||||
| Liberal Democrats win (new seat) | |||||
| Liberal Democrats win (new seat) | |||||
Oldfield
| Party | Candidate | Votes | % | ±% | |
|---|---|---|---|---|---|
| Liberal Democrats | Ruth Griffiths * | 956 | 56.8 | +12.4 | |
| Liberal Democrats | Shaun McGall | 853 | – | ||
| Labour | Hilary Fraser * | 568 | 33.3 | –12.9 | |
| Labour | Lynn David Harrington | 496 | – | ||
| Conservative | Kenneth Philip Cragg | 168 | 14.8 | +5.4 | |
| Conservative | Robert Peter Shorthouse | 153 | – | ||
| Turnout | 41.1 | ||||
| Registered electors | 4,060 | ||||
| Liberal Democrats hold | Swing | ||||
| Liberal Democrats gain from Labour | Swing | ||||
Paulton
| Party | Candidate | Votes | % | ±% | |
|---|---|---|---|---|---|
| Labour | Patricia Ann Hogg * | 693 | 71.7 | +18.3 | |
| Labour | Brian Colin Barrett * | 667 | – | ||
| Liberal Democrats | David Brassington | 186 | 19.3 | –2.8 | |
| Liberal Democrats | Tony Crouch | 161 | – | ||
| Green | Mark Strickson | 87 | 9.0 | –1.6 | |
| Turnout | 27.0 | ||||
| Registered electors | 3,730 | ||||
| Labour hold | Swing | ||||
| Labour hold | Swing | ||||
Peasedown
| Party | Candidate | Votes | % | ±% | |
|---|---|---|---|---|---|
| Labour | Matthew Neal Davis * | 596 | 49.3 | –20.3 | |
| Labour | Peter Jovic-Sas | 499 | – | ||
| Liberal Democrats | Roger Martin Clark | 356 | 29.4 | +11.6 | |
| Liberal Democrats | Andrew John Wait | 284 | – | ||
| Conservative | Mark Andrew Jones | 258 | 21.3 | +9.2 | |
| Conservative | Robin John Maggs | 255 | – | ||
| Turnout | 28.9 | ||||
| Registered electors | 4,216 | ||||
| Labour hold | Swing | ||||
| Labour hold | Swing | ||||
Publow with Whitchurch
| Party | Candidate | Votes | % | ±% | |
|---|---|---|---|---|---|
| Labour | Marilyn Ann Hawkings | 291 | 45.9 | ||
| Conservative | Douglas George Miles * | 266 | 42.0 | ||
| Liberal Democrats | Mark Harley Davies | 77 | 12.1 | ||
| Majority | 25 | 3.9 | |||
| Turnout | 33.5 | ||||
| Registered electors | 1,890 | ||||
| Labour win (new seat) | |||||
Radstock
| Party | Candidate | Votes | % | ±% | |
|---|---|---|---|---|---|
| Independent Labour | Phyllis Gay | 653 | 46.4 | N/A | |
| Independent Labour | Jonathan Jeffrey Gay | 545 | – | ||
| Labour | Christopher John Dando * | 441 | 31.4 | –43.8 | |
| Labour | Anne Marie Jovic Sas | 287 | – | ||
| Green | Michael Boulton | 157 | 11.2 | N/A | |
| Liberal Democrats | Paula Ann Kitley | 155 | 11.0 | –6.1 | |
| Liberal Democrats | Richard James Kitley | 112 | – | ||
| Turnout | 32.7 | ||||
| Registered electors | 3,845 | ||||
| Independent Labour gain from Labour | Swing | ||||
| Independent Labour gain from Labour | Swing | ||||
Saltford
| Party | Candidate | Votes | % | ±% | |
|---|---|---|---|---|---|
| Conservative | Francine Haeberling * | 842 | 61.1 | +10.9 | |
| Conservative | Gordon Wood * | 753 | – | ||
| Labour | Richard Bateman | 349 | 25.3 | –3.0 | |
| Labour | Beverley Michaela Hunt | 233 | – | ||
| Liberal Democrats | Anne Ledbetter | 188 | 13.6 | –7.9 | |
| Liberal Democrats | Hugh Jonathan Warren | 149 | – | ||
| Turnout | 37.6 | ||||
| Registered electors | 3,411 | ||||
| Conservative hold | Swing | ||||
| Conservative hold | Swing | ||||
Southdown
| Party | Candidate | Votes | % | ±% | |
|---|---|---|---|---|---|
| Liberal Democrats | Angela Godfrey * | 978 | 72.1 | +8.6 | |
| Liberal Democrats | Paul Crossley | 944 | – | ||
| Labour | John Peter Salt | 228 | 16.8 | –8.7 | |
| Labour | Kathleen Salt | 180 | – | ||
| Conservative | John Grant Ferrie | 150 | 11.1 | +0.1 | |
| Conservative | John Hamer Powell | 146 | – | ||
| Turnout | 31.6 | ||||
| Registered electors | 4,314 | ||||
| Liberal Democrats hold | Swing | ||||
| Liberal Democrats hold | Swing | ||||
Timsbury
| Party | Candidate | Votes | % | ±% | |
|---|---|---|---|---|---|
| Labour | Graham Denis Stewart | 479 | 59.0 | +1.2 | |
| Conservative | William Alan Brown | 255 | 31.4 | +4.5 | |
| Liberal Democrats | David Matthews | 78 | 9.6 | –5.8 | |
| Majority | 224 | 27.6 | –3.3 | ||
| Turnout | 38.7 | ||||
| Registered electors | 2,102 | ||||
| Labour hold | Swing | ||||
Twerton
| Party | Candidate | Votes | % | ±% | |
|---|---|---|---|---|---|
| Liberal Democrats | Tim Ball * | 789 | 72.1 | +10.1 | |
| Liberal Democrats | Carol Anne Brown | 667 | – | ||
| Labour | Karen Ruth Weston | 223 | 20.4 | –12.0 | |
| Labour | Stewart Edward Weston | 213 | – | ||
| Conservative | Roger Waterhouse Smith | 82 | 7.5 | +1.2 | |
| Conservative | Kenneth James McLeod | 77 | – | ||
| Turnout | 29.1 | ||||
| Registered electors | 3,886 | ||||
| Liberal Democrats hold | Swing | ||||
| Liberal Democrats hold | Swing | ||||
Walcot
| Party | Candidate | Votes | % | ±% | |
|---|---|---|---|---|---|
| Liberal Democrats | Wahidus Samad Chowdhury | 577 | 38.8 | –0.1 | |
| Liberal Democrats | Godfrey Randall Hall | 525 | – | ||
| Labour | Jean Adamson Campbell | 470 | 31.6 | –1.7 | |
| Labour | Peter John Robert Norris | 461 | – | ||
| Conservative | Brian Webber | 378 | 25.4 | –0.3 | |
| Conservative | Benedict John Rogers | 364 | – | ||
| Independent | Nicholas Hales | 64 | – | ||
| Turnout | 32.6 | ||||
| Registered electors | 4,488 | ||||
| Liberal Democrats hold | Swing | ||||
| Liberal Democrats hold | Swing | ||||
Westfield
| Party | Candidate | Votes | % | ±% | |
|---|---|---|---|---|---|
| Labour | Walter D. J. T. Reakes * | 643 | 75.5 | +9.0 | |
| Labour | Laurence William Carruthers * | 546 | – | ||
| Liberal Democrats | Peter Clive Buckly Roberts | 209 | 24.5 | +1.4 | |
| Liberal Democrats | Jean Rose Elizabeth Vine | 193 | – | ||
| Turnout | 20.9 | ||||
| Registered electors | 4,171 | ||||
| Labour hold | Swing | ||||
| Labour hold | Swing | ||||
Westmoreland
| Party | Candidate | Votes | % | ±% | |
|---|---|---|---|---|---|
| Liberal Democrats | Sharon Grace Ball * | 769 | 53.6 | +9.6 | |
| Liberal Democrats | Lynda Hedges | 690 | – | ||
| Labour | Gillian Wendy Pitman * | 494 | 34.4 | –9.3 | |
| Labour | Sylvia Back | 463 | – | ||
| Conservative | Susan Gillian Henley Green | 173 | 12.0 | –1.6 | |
| Conservative | Caroline Jane Haslett | 155 | – | ||
| Turnout | 34.6 | ||||
| Registered electors | 4,198 | ||||
| Liberal Democrats hold | Swing | ||||
| Liberal Democrats gain from Labour | Swing | ||||
Weston
| Party | Candidate | Votes | % | ±% | |
|---|---|---|---|---|---|
| Liberal Democrats | Timothy John Bullamore | 920 | 46.7 | –4.2 | |
| Liberal Democrats | Jane Marilyn Tapper | 914 | – | ||
| Conservative | Colin Barrett | 893 | 45.3 | +19.0 | |
| Conservative | Henry Charles Rendall | 755 | – | ||
| Labour | Frances Evelyn Kinsella | 158 | 8.0 | –8.8 | |
| Labour | Margaret Ann Pearce | 145 | – | ||
| Turnout | 47.5 | ||||
| Registered electors | 4,175 | ||||
| Liberal Democrats hold | Swing | ||||
| Liberal Democrats hold | Swing | ||||
Widcombe
| Party | Candidate | Votes | % | ±% | |
|---|---|---|---|---|---|
| Liberal Democrats | Peter John Metcalfe * | 875 | 55.1 | –0.9 | |
| Liberal Democrats | Nicole Mauricette O'Flaherty | 800 | – | ||
| Conservative | Peter Hilland | 390 | 24.5 | –1.5 | |
| Conservative | Gervase Antony Manfred O'Donovan | 375 | – | ||
| Green | Susan Patricia Bradley | 162 | 10.2 | N/A | |
| Labour | Mary Elizabeth Young | 162 | 10.2 | –7.7 | |
| Labour | Celia Philippa Mower | 152 | – | ||
| Turnout | 35.0 | ||||
| Registered electors | 4,319 | ||||
| Liberal Democrats hold | Swing | ||||
| Liberal Democrats hold | Swing | ||||
By-elections between 1999 and 2003
Lansdown
| Party | Candidate | Votes | % | ±% | |
|---|---|---|---|---|---|
| Conservative | David Hawkins | 777 | 52.1 | –5.2 | |
| Liberal Democrats | 517 | 34.7 | +2.8 | ||
| Labour | 101 | 6.8 | –3.9 | ||
| Green | 96 | 6.4 | N/A | ||
| Majority | 260 | 17.4 | |||
| Turnout | 1,491 | 39.9 | |||
| Registered electors | |||||
| Conservative hold | Swing | ||||
Bathavon North
| Party | Candidate | Votes | % | ±% | |
|---|---|---|---|---|---|
| Conservative | Martin Veal | 993 | 50.5 | –2.9 | |
| Liberal Democrats | 699 | 35.6 | +6.5 | ||
| Labour | 273 | 13.9 | –3.7 | ||
| Majority | 294 | 14.9 | |||
| Turnout | 1,965 | 34.5 | |||
| Registered electors | |||||
| Conservative hold | Swing | ||||
Lansdown
| Party | Candidate | Votes | % | ±% | |
|---|---|---|---|---|---|
| Conservative | 667 | 56.1 | –1.2 | ||
| Liberal Democrats | 417 | 35.1 | +3.2 | ||
| Green | 62 | 5.2 | N/A | ||
| Labour | 42 | 3.5 | –7.2 | ||
| Majority | 250 | ||||
| Turnout | 31.6 | ||||
| Registered electors | |||||
| Conservative hold | Swing | ||||
Walcot
| Party | Candidate | Votes | % | ±% | |
|---|---|---|---|---|---|
| Liberal Democrats | 478 | 36.9 | –1.9 | ||
| Conservative | 386 | 29.8 | +4.4 | ||
| Labour | 276 | 21.3 | –10.3 | ||
| Green | 116 | 9.0 | N/A | ||
| Other | 39 | 3.0 | N/A | ||
| Majority | 92 | 7.1 | |||
| Turnout | 1,295 | 29.4 | |||
| Registered electors | |||||
| Liberal Democrats hold | Swing | ||||
References
- General
- "Local Election - Thursday, 6th May, 1999". Bath and North East Somerset Council. Retrieved 23 January 2020.
- "Bath & North East Somerset Council Election Results 1995-2011" (PDF). The Elections Centre (Plymouth University). Retrieved 16 April 2020.
- Specific
- "Abbey Ward". Bath and North East Somerset Council. Retrieved 24 January 2020.
- "Bathavon North". Bath and North East Somerset Council. Retrieved 24 January 2020.
- "Bathavon South". Bath and North East Somerset Council. Retrieved 24 January 2020.
- "Bathavon West". Bath and North East Somerset Council. Retrieved 24 January 2020.
- "Bathwick". Bath and North East Somerset Council. Retrieved 24 January 2020.
- "Chew Valley North". Bath and North East Somerset Council. Retrieved 24 January 2020.
- "Chew Valley South". Bath and North East Somerset Council. Retrieved 24 January 2020.
- "Clutton". Bath and North East Somerset Council. Retrieved 24 January 2020.
- "Combe Down". Bath and North East Somerset Council. Retrieved 24 January 2020.
- "Farmborough". Bath and North East Somerset Council. Retrieved 24 January 2020.
- "High Littleton". Bath and North East Somerset Council. Retrieved 24 January 2020.
- "Keynsham East". Bath and North East Somerset Council. Retrieved 24 January 2020.
- "Keynsham North". Bath and North East Somerset Council. Retrieved 24 January 2020.
- "Keynsham South". Bath and North East Somerset Council. Retrieved 24 January 2020.
- "Kingsmead". Bath and North East Somerset Council. Retrieved 24 January 2020.
- "Lambridge". Bath and North East Somerset Council. Retrieved 24 January 2020.
- "Lansdown". Bath and North East Somerset Council. Retrieved 24 January 2020.
- "Lyncombe". Bath and North East Somerset Council. Retrieved 24 January 2020.
- "Mendip". Bath and North East Somerset Council. Retrieved 24 January 2020.
- "Midsomer Norton North". Bath and North East Somerset Council. Retrieved 24 January 2020.
- "Midsomer Norton Redfield". Bath and North East Somerset Council. Retrieved 24 January 2020.
- "Newbridge". Bath and North East Somerset Council. Retrieved 24 January 2020.
- "Odd Down". Bath and North East Somerset Council. Retrieved 24 January 2020.
- "Oldfield". Bath and North East Somerset Council. Retrieved 24 January 2020.
- "Paulton". Bath and North East Somerset Council. Retrieved 24 January 2020.
- "Peasedown". Bath and North East Somerset Council. Retrieved 24 January 2020.
- "Publow with Whitchurch". Bath and North East Somerset Council. Retrieved 24 January 2020.
- "Radstock". Bath and North East Somerset Council. Retrieved 24 January 2020.
- "Saltford". Bath and North East Somerset Council. Retrieved 24 January 2020.
- "Southdown". Bath and North East Somerset Council. Retrieved 24 January 2020.
- "Timsbury". Bath and North East Somerset Council. Retrieved 24 January 2020.
- "Twerton". Bath and North East Somerset Council. Retrieved 24 January 2020.
- "Walcot". Bath and North East Somerset Council. Retrieved 24 January 2020.
- "Westfield". Bath and North East Somerset Council. Retrieved 24 January 2020.
- "Westmoreland". Bath and North East Somerset Council. Retrieved 24 January 2020.
- "Weston". Bath and North East Somerset Council. Retrieved 24 January 2020.
- "Widcombe". Bath and North East Somerset Council. Retrieved 24 January 2020.
- "Bath and Northeast Somerset UA, Lansdown". Retrieved 16 April 2020.
- "Bath and Northeast Somerset UA, Bathavon North". Retrieved 16 April 2020.
- "Bath and Northeast Somerset UA, Lansdown". Retrieved 16 April 2020.
- "Bath and Northeast Somerset UA, Walcot". Retrieved 16 April 2020.
 Council elections in Somerset | |
|---|---|
| Somerset County Council | |
| Bath and North East Somerset Council | |
| Mendip District Council | |
| North Somerset Council | |
| Sedgemoor District Council | |
| South Somerset District Council | |
| Somerset West and Taunton District Council | |
| Avon County Council |
|
| Bath City Council | |
| Taunton Deane Borough Council | |
| Wansdyke District Council |
|
| West Somerset District Council | |
| West of England Mayor | |
| |
| Metropolitan boroughs |
|
|---|---|
| Unitary authorities |
|
| District councils (England) |
|
| Welsh councils |
|
| Scottish councils |
|
| National Assembly elections | |
| |
This article is issued from Wikipedia. The text is licensed under Creative Commons - Attribution - Sharealike. Additional terms may apply for the media files.